A significant decrease in new citizenships granted by the United Kingdom and Germany (respectively -21% and -16%) was not counterbalanced completely by the increases recorded in Italy (18%), Spain (17%), and France (4%). Some Member States, particularly Greece, Portugal and Romania, saw a high increase in the number of citizenships granted, mostly due to changes and simplifications introduced in their respective nationality laws.
In absolute terms, France, the UK and Germany Relative to the resident population, Sweden and granted the highest number of new citizenships. Luxembourg were the EU countries which granted Since 2002 these three countries have always been the highest number of citizenships per inhabitant. the top three, but their contribution to the EU-27 In both cases, however, the ratio per thousand total has decreased from an average of 60% over inhabitants recorded in 2008 was lower than in the period 2002-2007 to slightly more than 50% in 2007 (a decline from 3.7 to 3.3 for Sweden, and 2008. from 2.6 to 2.5 for Luxembourg).
Outside the EU-27 a very high number of new citizenships per thousand inhabitants was granted by SwitzerlandIceland, Norway and Croatia granted a relatively high number of new citizenships, above the EU-27 average. (approximately 5.8, the same value as for 2007). Also
Particularly relevant is the ratio between the total number of new citizenships granted by each country and the size of the resident foreign population. The average for the EU-27 was slightly more than 23 acquisitions per thousand foreigners in 2008, a value 2% lower than that recorded for 2007. The countries with the highest ratios were Sweden and Portugal, with more than 50 acquisitions per thousand foreigners. The ratio for Sweden, while still the highest within the EU-27, has been decreasing over the last few years. The figure recorded in 2008 was 20% lower than for 2007 and about half of what was recorded in 2006.
At EU level, more than 90% of those who acquired citizenship of a Member State were previously citizens of non-EU countries. This is true for almost all Member States, with very few exceptions. Only in two cases was the majority of new citizenships granted to citizens of another EU Member State: in Hungary (72%) and Luxembourg (56%). In the case of Hungary this was largely due to persons of Romanian citizenship. In the case of Luxembourg, the persons were citizens of Portugal, Italy, Belgium or Germany.
In absolute terms the main groups of citizens of an EU Member State who became citizens of another Member State were Portuguese becoming citizens of France (7 778 persons), Romanians becoming citizens of Hungary (5 535 persons), and Poles becoming citizens of Germany (4 245 persons).
In the EU almost one new citizen out of ten was a citizen of Morocco
As in previous years, citizens of Morocco and The majority of Moroccans acquired citizenship Turkey are the largest groups who acquired either in France (28 699 persons), or in Italy (9 156 citizenship of an EU Member State in 2008. persons), or in Spain (8 615 persons). In contrast, Compared to 2007, the number of Moroccans Turks mainly acquired citizenship either in acquiring citizenship in the EU rose by 7%, while Germany (24 449 persons), or in France (10 202 the number of Turks fell by 10%. persons).
Focussing on the first thirty groups of previous citizenship, that account for approximately two thirds of total acquisitions, we observe that for nearly half of them the majority of total acquisitions occurred in one single Member State. In some cases this percentage exceeds 70%: citizens of Algeria, Tunisia and Portugal becoming French citizens, citizens of India, Pakistan and Somalia becoming UK citizens, citizens of Ecuador, Colombia and Peru becoming Spanish citizens, and citizens of Cape Verde becoming Portuguese citizens.
It is interesting to evaluate the ratio between the total number of acquisitions from a particular group and the size of the foreign population of that group in the EU-27. Considering the thirty groups that record the highest number of acquisitions, we see that this ratio is particularly high for citizens of Iraq, Afghanistan, Somalia and Cape Verde. In the first three cases, the result is linked to the flow of refugees and asylum seekers from these countries, for whom there might be a strong incentive to acquire citizenship in their new country of residence.
Nearly half of new citizens in the EU aged under 30 years
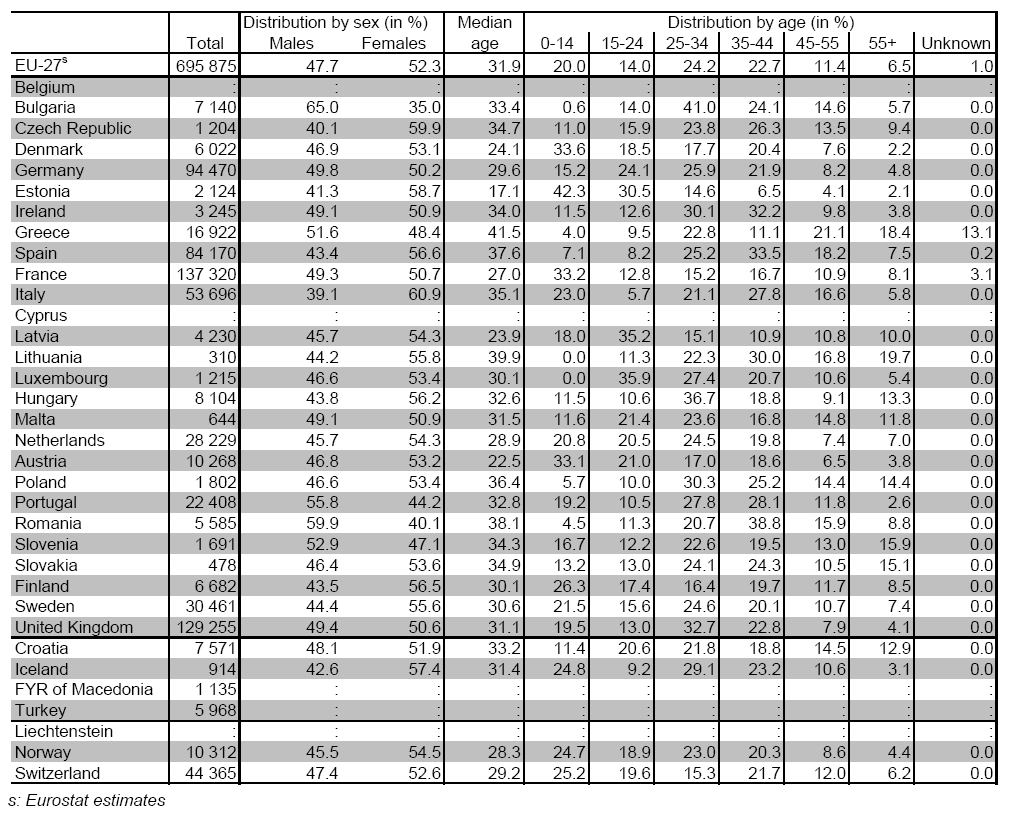
The distribution by sex of persons who acquired citizenship of an EU Member State in 2008 was quite balanced, with a slight predominance of females (52.3%) at EU level. This was true for the vast majority of Member States: males exceeded females only in five cases, namely in Bulgaria, Romania, Portugal, Slovenia and Greece.
The highest proportion of males was recorded for Bulgaria () and the highest proportion of females for Italy (56.2%).
The data show that the persons acquiring a new citizenship are primarily young adults and children. The distribution by age of new citizens at EU level shows two distinct peaks, one corresponding to the age group 10-14 and a second, also the absolute peak, corresponding to the age group 30-34. The latter age group accounts for approximately one in seven acquisitions, and includes the overall median age for the EU-27, 31.9 years.
For the vast majority of Member States the median age of new citizens is included in the range between 25 and 35 years. The most notable exceptions are Estonia, for which half of the new citizens were younger than 17.1 years, and Greece, for which half of the new citizens were older than 41.5 years.
METHODOLOGICAL NOTES
Citizenship – The particular legal bond between an individual and his or her State, acquired by birth or naturalisation, whether by declaration, choice, marriage or other means according to the national legislation. International law does not provide detailed rules, but it recognises the competence of every State in cases like: spouses of nationals, minors adopted by nationals, descendants of nationals born abroad returning to the country of origin of their ancestors, etc.
Countries differ considerably in terms of the conditions to be fulfilled to acquire citizenship: in general a period of legally registered residence is required, combined with other factors such as evidence of social and economic integration and knowledge of national languages. Different conditions may apply for persons who were born in the country concerned (jus soli), or who have parents or other relatives with that country’s citizenship (jus sanguinis). For an overview of the conditions to be fulfilled in each country, see the Annex on national methodologies in the Eurostat Metadata page.
Median age – The age that divides a population into two groups that are numerically equivalent.
Recognised non-citizen – Person who is not a citizen of the reporting country nor of any other country, but who has established links to that country which include some but not all rights and obligations of full citizenship. This category is particularly relevant in Estonia, Latvia and Lithuania.
ABBREVIATIONS:
EU-27 Member States: Belgium (BE), Bulgaria (BG), Czech Republic (CZ), Denmark (DK), Germany (DE), Estonia (EE), Ireland (IE), Greece (EL), Spain (ES), France (FR), Italy (IT), Cyprus (CY), Latvia (LV), Lithuania (LT), Luxembourg (LU), Hungary (HU), Malta (MT), Netherlands (NL), Austria (AT), Poland (PL), Portugal (PT), Romania (RO), Slovenia (SI), Slovakia (SK), Finland (FI), Sweden (SE) and United Kingdom (UK). Candidate countries: Croatia (HR), Iceland (IS), The former Yugoslav Republic of Macedonia (MK) and Turkey (TR). EFTA countries: Liechtenstein (LI), Norway (NO) and Switzerland (CH).
SOURCE: http://epp.eurostat.ec.europa.eu/cache/ITY_OFFPUB/KS-SF-10-036/EN/KS-SF-10-036-EN.PDF
TABLES:
Figure 1: Total acquisitions of citizenship in the EU-27
Figure 2: Total acquisitions of citizenship in the EU-27, relative change on previous year
Table 1: Acquisitions of citizenship, 1998-2008
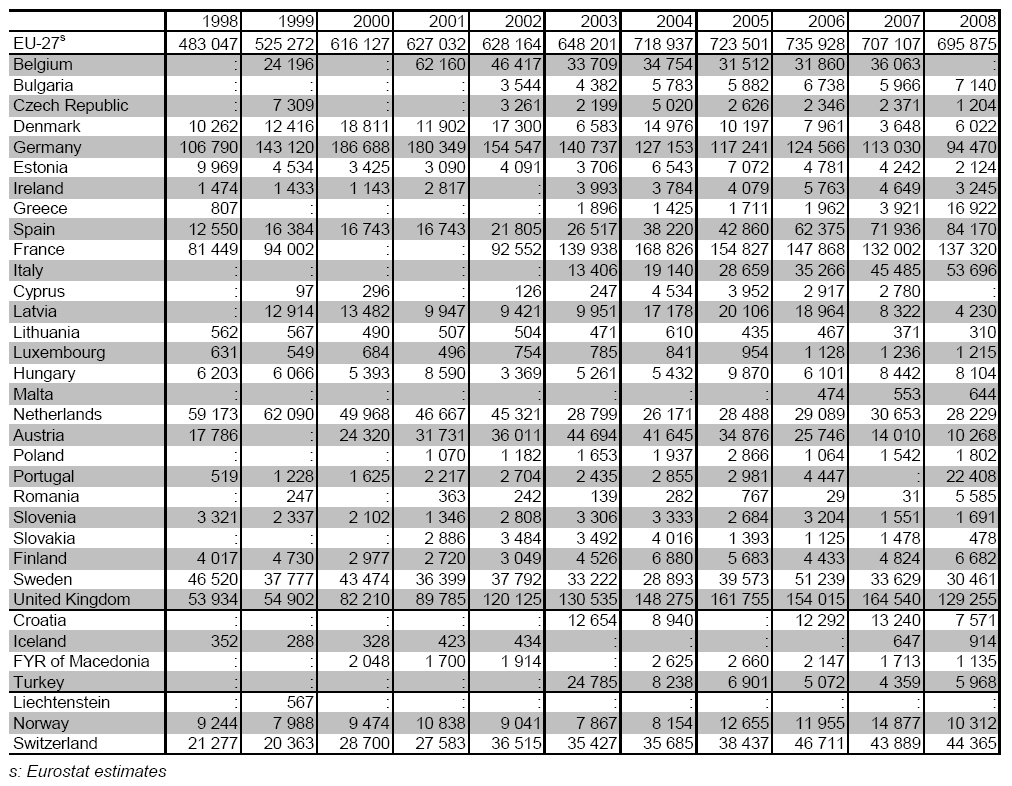
Figure 3: Acquisitions of citizenship per thousand inhabitants, 2008
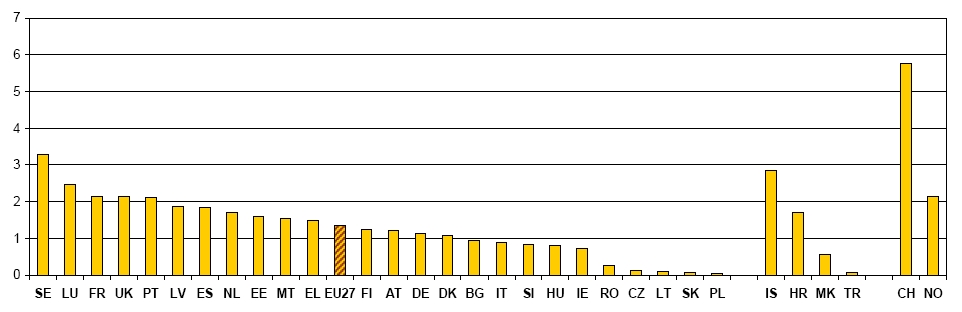
Figure 4: Acquisitions of citizenship per thousand non-nationals, 2008
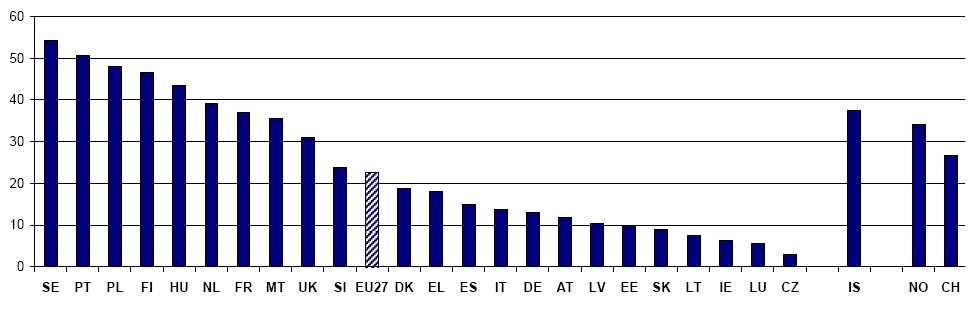
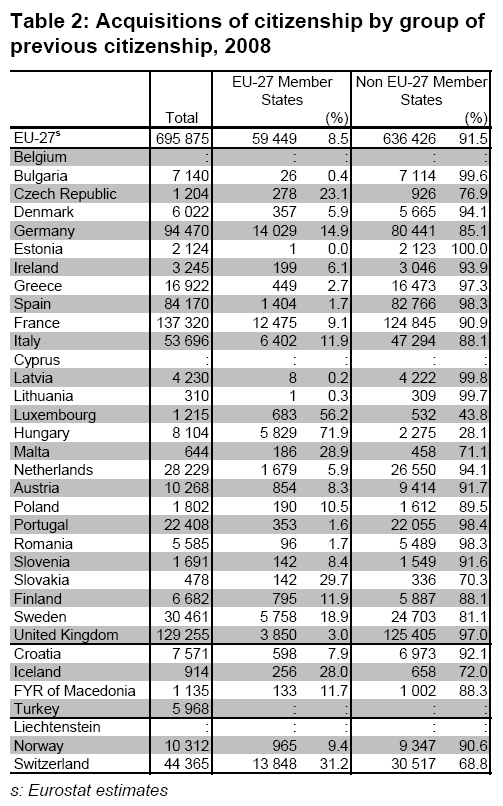
Table 3: Main previous citizenships of persons acquiring citizenship in the EU-27, EFTA and Candidate countries, 2008
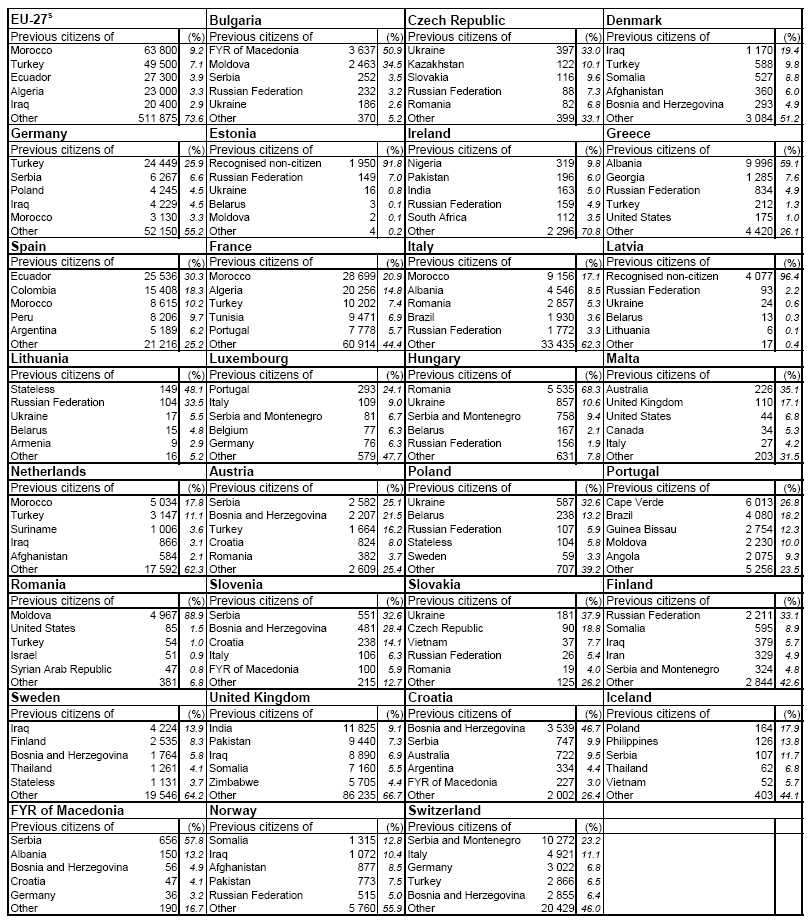
Figure 5: Main previous citizenship of persons acquiring citizenship in the EU-27, per thousand foreign population of the same citizenship, 2008
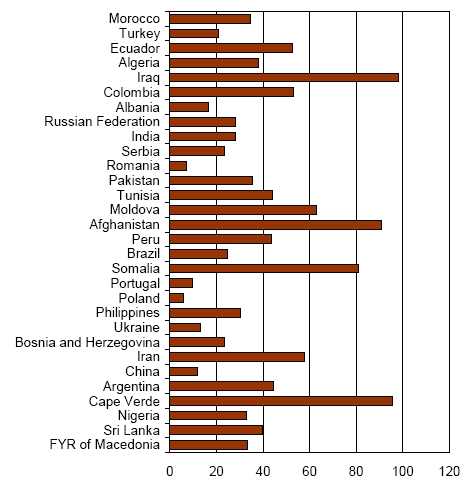
Table 4: Main previous citizenship of persons acquiring citizenship in the EU-27 and main EU Member States granting citizenship, 2008
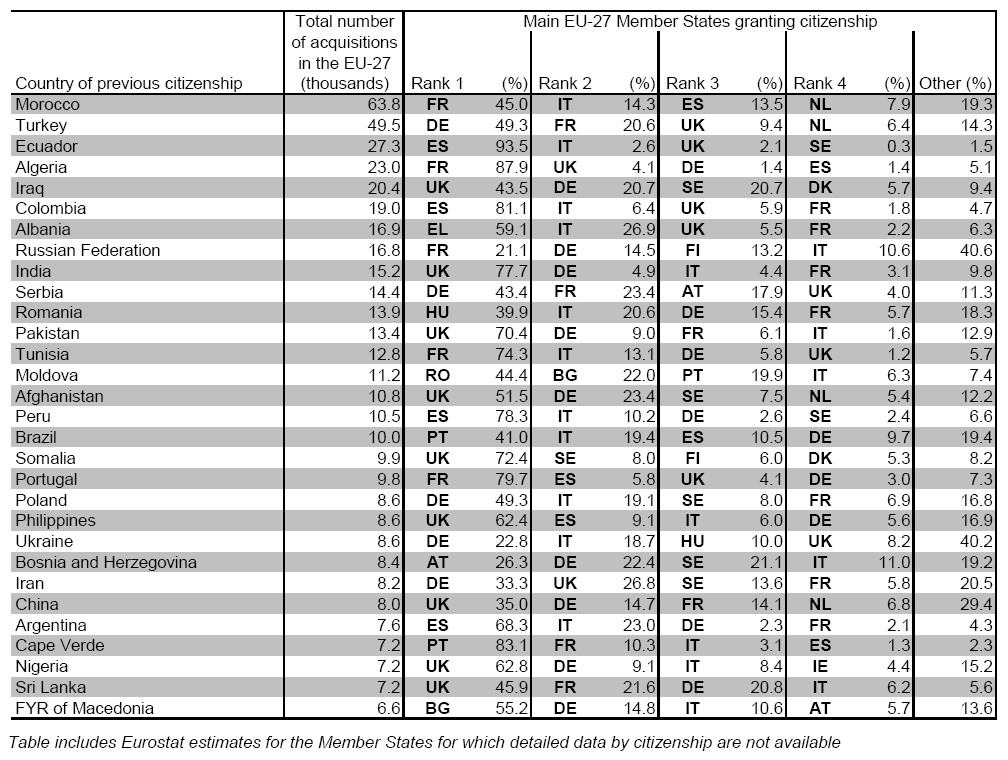
Figure 6: Median age of persons acquiring citizenship in the EU-27, EFTA and Candidate countries, 2008
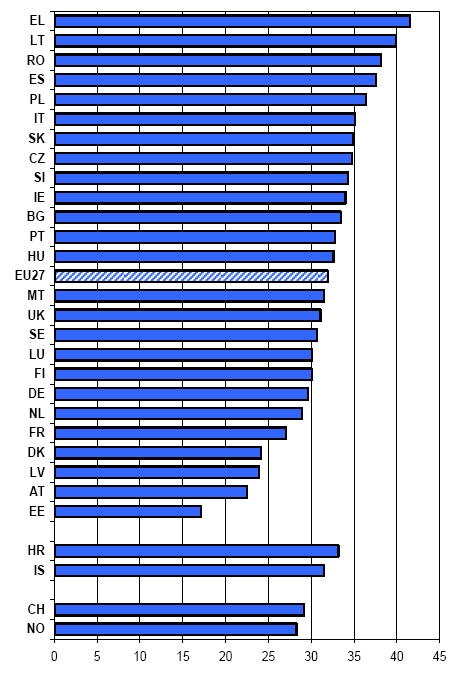
Figure 7: Age distribution of persons acquiring citizenship in the EU-27, 2008
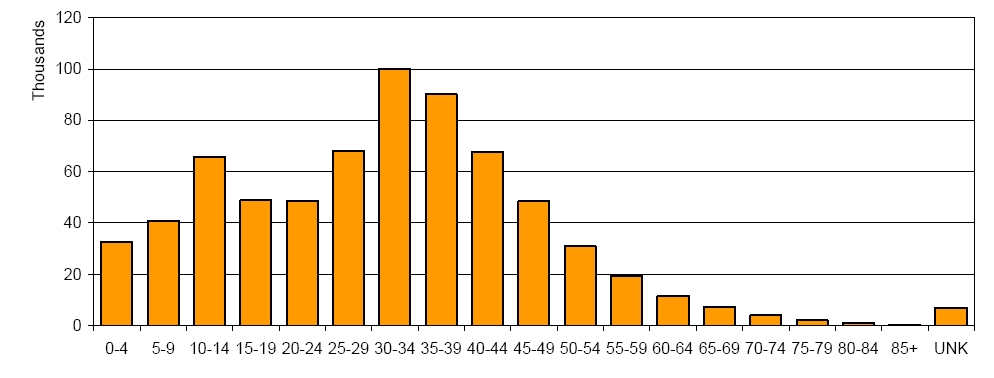
Table 5: Sex and age distribution of the persons acquiring citizenship of EU-27, EFTA and Candidate countries, 2008